
An overview of Economic Conditions, Bargaining Climate and Wage Settlements Across Canada
June 2004
This note provides broad overview of the general trends in wage settlements and other relevant bargaining information across Canada. Information is taken primarily from the Workplace Information Directorate of Human Resources Development Canada (HRDC) and Statistics Canada.
Current Economic Conditions
In terms of economic growth, Newfoundland and Labrador led the way with GDP growth of 6.5% in 2003 largely on the basis of oil production, and Saskatchewan came out of two years of drought with GDP growth of 4.5%. New Brunswick, Alberta, B.C., and PEI were all above the Canadian average. Quebec, Manitoba, Ontario and Nova Scotia were all below the Canadian average. On a Canadian basis, real GDP growth is at 2.4% annualized for the 1st quarter largely because of a strong Canadian dollar and increased consumer spending. Commentators expect the growth will continue in the 2nd quarter.
Unemployment in the 1st quarter of 2004 was down slightly at 7.4%. Private sector employment increased by 49,000 at the beginning of the 2nd quarter (April). 34,700 of those jobs were self-employed. Public sector employment increased by a mere 500 indicating that public sector employers are cutting back.
Corporate profits grew at an annualized rate of 6.1% in the first four months of 2004 to remain at record highs. This growth was driven by mineral fuels, manufacturing and government owned electric power utilities.
Inflation remains low. The consumer price index is falling with only a 0.9% average increase over the 1st quarter. Projections are that the CPI will not exceed 2.0% in 2004.
| Table 1: Key Economic Indicators | |||
|
| 2002 | 2003 | 1st Quarter 2004 |
| Real GDP Growth* | 3.4% | 1.9% | 2.4% |
| Unemployment | 7.7% | 7.6% | 7.4% |
| Increase in Corporate Profits | 8.6% | 10.0% | 6.1% |
| CPI | 2.2% | 2.8% | 0.9% |
* GDP is the Gross Domestic Product or the value of all goods and services produced in Canada “Real” GDP is a measure of that value adjusted for inflation.
Source: Statistics Canada
| Table 2: Economic Forecasts | |||||
|
| Real GDP | CPI | Unemployment | Corporate profits | |
| Global Economic Research | |||||
| 2004 | 2.3% | 1.5% | 7.4% | 8.0% | |
| 2005 | 3.0% | 2.0% | 7.3% | 7.0% | |
|
| |||||
| CIBC | |||||
| 2004 | 2.4% | 1.6% | 7.5% | 6.4% | |
| 2005 | 3.2% | 1.8% | 7.3% | 5.6% | |
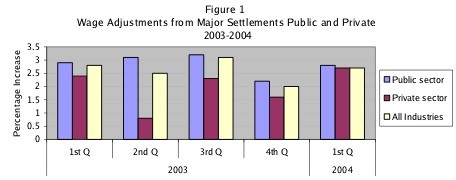
Wage Adjustments from Major Settlements
Public sector wage settlements remained steady throughout 2003 and for the 1 st quarter of 2004 with a low of 2.2 per cent in the 4th quarter of 2003 and a high of 3.2 per cent in the 3rd quarter of 2003. Public sector wage adjustments ran at 2.8 per cent in the 1st quarter of 2004 (see figure 1.)
Private sector settlements have lagged behind public sector settlements as they ranged from 0.8 per cent in the 2nd quarter of 2003 to a high of 2.7 per cent in the 1st quarter of 2004. However, private sector settlements appear to be on a path to eclipse the public sector as private sector wage adjustments in March 2003 were 3.2 per cent while public sector adjustments were only 2.2 per cent.
Note that aggregate data incorporating the full impact of legislated settlements in both B.C. and Newfoundland and Labrador are not yet available. Significant concessions in those settlements were imposed in April and May and will greatly reduce the public sector settlement figures in the 2nd quarter of 2004. Details on these forced agreements are provided below.
Provincial Trends
Figure 2 shows wage increases by province for all industries for the1 st quarter of 2004. Alberta led the way at 3.7 per cent while in B.C. with its wage rollbacks settlements recorded an average wage decrease of –1.2 per cent for the 1st quarter and –2.1 per cent for March. The data reflect only a 4.1 per cent rollback for employees of the Health Employers Association of British Columbia. However, we know that total rollbacks in the order of 11 per cent were implemented and will show up in the aggregate figures for the next quarter.
In March wage settlements were highest in Quebec at 4.1 per cent as lecturers at Laval University negotiated a 6.3 per cent increase.
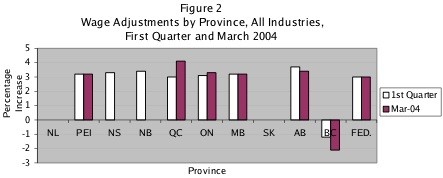
Source: Workplace Information, The Wage Settlements Bulletin, May 2004
CUPE members, health care workers in particular, have had significant concessions forced upon them through legislation in both British Columbia and Newfoundland and Labrador.
British Columbia Hospital Employees’ Union
Highly regressive legislation in B.C. (Bill 37) sparked a strike by HEU and escalating labour protests from other unions. A two-year memorandum of agreement was reached with the following provisions:
- An enhanced severance fund of $25 million for health care workers displaced by contracting out.
- A cap on further contracting out at 600 FTEs.
- No retroactivity on wage rollbacks.
The legislation invoked an 11 per cent wage cut effective May 1, 2004 plus an increase in the workweek from 36 to 37.5 per week equivalent to a further 4 per cent cut in the hourly rate.
Newfoundland and Labrador – CUPE and NAPE
After a 27-day strike in April the Newfoundland and Labrador government passed legislation imposing:
- A two-year wage freeze in 2004 and 2005.
- A 2 per cent increase in 2006 and a 3 per cent increase in 2007.
- A reduction in sick leave accumulation for new employees to one day per month to a maximum of 12 days per year with a total cap of 240 days.
- A new job evaluation plan will begin implementation on April 1, 2008 but wage adjustments will not accrue on that date. Cost and timing of wage adjustments will be negotiated in the next round of bargaining.
The legislation covers over 20,000 of CUPE and NAPE and expires on March 31, 2008.
Major Settlements
| Table 3: Select Recent Major Settlements | |||
| Employer | Average Annual Increase | # of Employees | Expiry Date |
| Ontario Power Generation (2 agreements) | 3.0% | 3,900 | Dec 31, 2004 |
| CNR (2 agreements) | 3.0% | 5,210 | Dec 31, 2006 |
| Purolator Courier | 3.0% | 8,000 | Dec 31, 2007 |
| Calgary Laboratory Services | 5.5% | 950 | June 30, 2005 |
| Calgary RCSD # 1 | 3.2% | 1,360 | Aug 31, 2007 |
| College Compensation and App’ts Council (Ont.) | 3.7% | 8,600 | Aug 31, 2005 |
| Gov’t of Alta Health Services Employees | 3.5% | 1,190 | Aug 31, 2004 |
| PEI Health Authorities Admin. Services | 3.2% | 640 | Mar 31, 2006 |
| Health Employers Assoc of B.C. | -2.1% | 13,500 | Mar 31, 2006 |
| Laval University Lecturers | 6.3% | 1,600 | Apr 30, 2006 |
| Pembina Trails SD (teachers) | 3.0% | 1,010 | June 30, 2004 |
| UQAM (admin) | 2.6% | 1,800 | Nov 30, 2004 |
| City of Winnipeg (police) | 3.4% | 1,550 | Dec 23, 2004 |
| Gov’t of Alta – admin. program (2 agreements) | 3.5% | 9,920 | Aug 31, 2004 |
| Gov’t of Alta – corrections | 3.5% | 2,070 | Aug 31, 2004 |
| Gov’t of Alta – Social workers | 3.5% | 2,670 | Aug 31, 2004 |
| Gov’t of Alta – Technical | 3.5% | 1,490 | Aug 31, 2004 |
| Prov’l Health Authorities of Alta – Nurses | 3.2% | 22,000 | Dec 31, 2006 |
Source: Workplace Information, The wage Settlements Bulletin, May 2004
Selected Current Key Public Sector Negotiations
The collective bargaining climate in each province and region will be influenced by the major negotiations in progress at the present time. Table 4 below highlights some of the key negotiations to watch.
| Table 4: Key Negotiations in Progress | ||
| Employer | Union | # of Employees |
| Gov’t of Canada | Various | 113,390 |
| Canada Revenue Agency | PSAC and PIPSC | 41,480 |
| Gov’t of Nova Scotia | CUPE (public works) | 1,600 |
| Capital District Health | NSGEU | 7,800 |
| Nova Scotia Health Org’s | CUPE | 3,000 |
| Gov’t of New Brunswick | CUPE (health) | 5,800 |
| Gov’t of New Brunswick | Nurses | 5,000 |
| Gov’t of New Brunswick | Teachers | 1,500 |
| Gov’t of PEI | Teachers | 1,500 |
| Gov’t of Quebec | Various | 323,470 |
| City of Montreal | Various | 8,770 |
| Ontario Nursing Homes | SEIU | 3,200 |
| Man. Reg’l Health Authorities | CUPE | 11,000 |
| Gov’t of Saskatchewan | SGEU | 9,860 |
| Sask. Assoc of Health Org’s | Various | 24,530 |
| Alberta Bds of Education | ATA | 13,360 |
| Health Authorities of Alberta | Various | 7,500 |
Source: Workplace Information, The Wage Settlements Bulletin
CUPE Research
TRANSMITTAL INFORMATION
Stan Marshall
Senior Officer, Research Branch
(613) 237-1590. ext. 228
smarshall@cupe.ca
June 14, 2004