Two studies recently released by Statistics Canada show clearly that Canada’s publicly-owned infrastructure – our roads, mass transit, water supplies, wastewater treatment facilities, power plants, bridges, ports, telecommunications and airports – has a positive impact on the productivity and economic performance of the Canadian business sector.
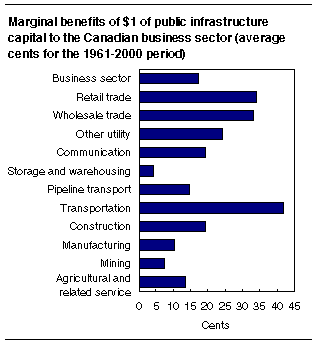
Public infrastructure, or “public capital” lowers the cost of producing a given level of output in almost every Canadian industry within the business sector. What does this mean? For example, a well-constructed highway allows a truck driver to avoid back roads and get the goods to market in less time. The reduced time means the producer has a lower cost and the truck experiences less wear and tear. So, public investment in this highway enables private companies to produce their goods at a lower total cost.
The two studies demonstrated that within the business sector as a whole, every $1 increase spent on infrastructure generated on average approximately 17 cents of cost-savings each year from 1961 to 2000.
As we in CUPE know, public capital investment has not kept pace with the growing economy – there is an “infrastructure crisis”. The studies highlight the relative decline in federal infrastructure and the increased responsibilities of municipalities for infrastructure across the country.
Since the early 1960s, the bulk of public infrastructure capital stock has been under the ownership of the provincial and local governments (45.3% and 30.9%) compared to about 25% for the federal government. In 2002, local government accounted for more than 50% of total public infrastructure, compared to 40.8% for the provincial government and a mere 6.8% for the federal government.
| Capital stock of public administrations in Canada | |||||||
| Total | Federal | Provincial | Local | ||||
| $ billion | $ billion | % | $ billion | % | $ billion | % | |
| 1961 | 9.3 | 2.2 | 23.9 | 4.2 | 45.3 | 2.9 | 30.9 |
| 1973 | 29.2 | 4.4 | 15.1 | 14.6 | 50.1 | 10.2 | 34.8 |
| 1979 | 64.4 | 7.7 | 12.0 | 33.2 | 51.5 | 23.6 | 36.6 |
| 1988 | 113.7 | 10.9 | 9.6 | 54.4 | 47.8 | 48.5 | 42.6 |
| 2000 | 155.2 | 11.2 | 7.2 | 65.1 | 41.9 | 78.9 | 50.9 |
| 2002 | 157.3 | 10.6 | 6.8 | 64.3 | 40.8 | 82.4 | 52.4 |
| Note: | Net of linear depreciation. | ||||||
Municipalities collect only 8 per cent of all taxes levied by governments in Canada, 55 per cent of which comes from property taxes. According to the Federation of Canadian Municipalities we have an infrastructure deficit of over $60 billion. So, Canadian municipalities are extremely dependent on the real estate market, but do not benefit from the economic growth generated on their territory.
These two studies highlight how important public infrastructure is to the Canadian economy – and add weight to CUPE’s campaign for a fair deal for Canadian municipalities.
In our September 2003 Pre-Budget Submission, we called for the following:
- The establishment of a National Environmental Infrastructure Investment Program with an annual investment of $6 billion a year, shared equally by all levels of government;
- The establishment of a National Infrastructure Investment Authority (seeded with $500 million);
- The encouragement for more public-public partnerships in infrastructure and thus more cooperation between municipalities (instead of P3s);
- Adequate funding for the infrastructure needs of communities across Canada, so that municipalities are not frightened into considering privatization by the huge estimates given for capital costs required to upgrade and expand infrastructure;
- The provision of special financial and technical assistance to address the acute and long-term infrastructure problems faced by First Nations communities.
Recent municipal election results give us confidence that our struggle will be advanced even further as we work together with the C5 group of Canada’s five largest cities for joint pressure on Ottawa for immediate action.
For further information on the two studies, visit the Statistics Canada web site.

