

Governments regularly borrow money to fund infrastructure and services. When these investments lead to economic growth, improve quality of life or prevent higher costs in the future, borrowing can make good fiscal sense.
If the economy is growing faster than the government’s debt, it suggests that borrowing is supporting economic growth. To measure this, many governments, including the Trudeau government, use the net debt-to-GDP ratio. This ratio expresses net debt as a percentage of gross domestic product (GDP), or the total value of all goods and services produced by an economy. Net debt is calculated by subtracting the value of government assets, like land, buildings and financial assets, from the total debt.
Comparing net debt to GDP doesn’t capture all the benefits of government investments to the economy. However, it does capture some of the benefits to economic growth of government investment in infrastructure and services. The net debt-to-GDP ratio thus gives a more accurate view of how borrowing affects the economy than looking at government debt levels alone.
In Canada, we measure the net debt-to-GDP ratio in two ways: with and without the Canadian Pension Plan (CPP) and Quebec Pension Plan (QPP) included. The CPP and QPP are considered government financial assets. Statistics Canada reports the net debt both with and without these funds because they are different from other financial assets. If you only want to consider assets the government can use to pay off its debt, you need to exclude the CPP and QPP because these assets are reserved for people’s pensions and can’t be used for other purposes. On the other hand, including these funds in net debt calculations helps us better understand the overall impact of government borrowing on the economy, since they represent real investments in our future.
Mainstream economists advise governments to keep their net debt-to-GDP ratios as low as possible, but academic research shows that there’s no magic number. Most observers are looking for stability, and big increases or decreases warrant further investigation.
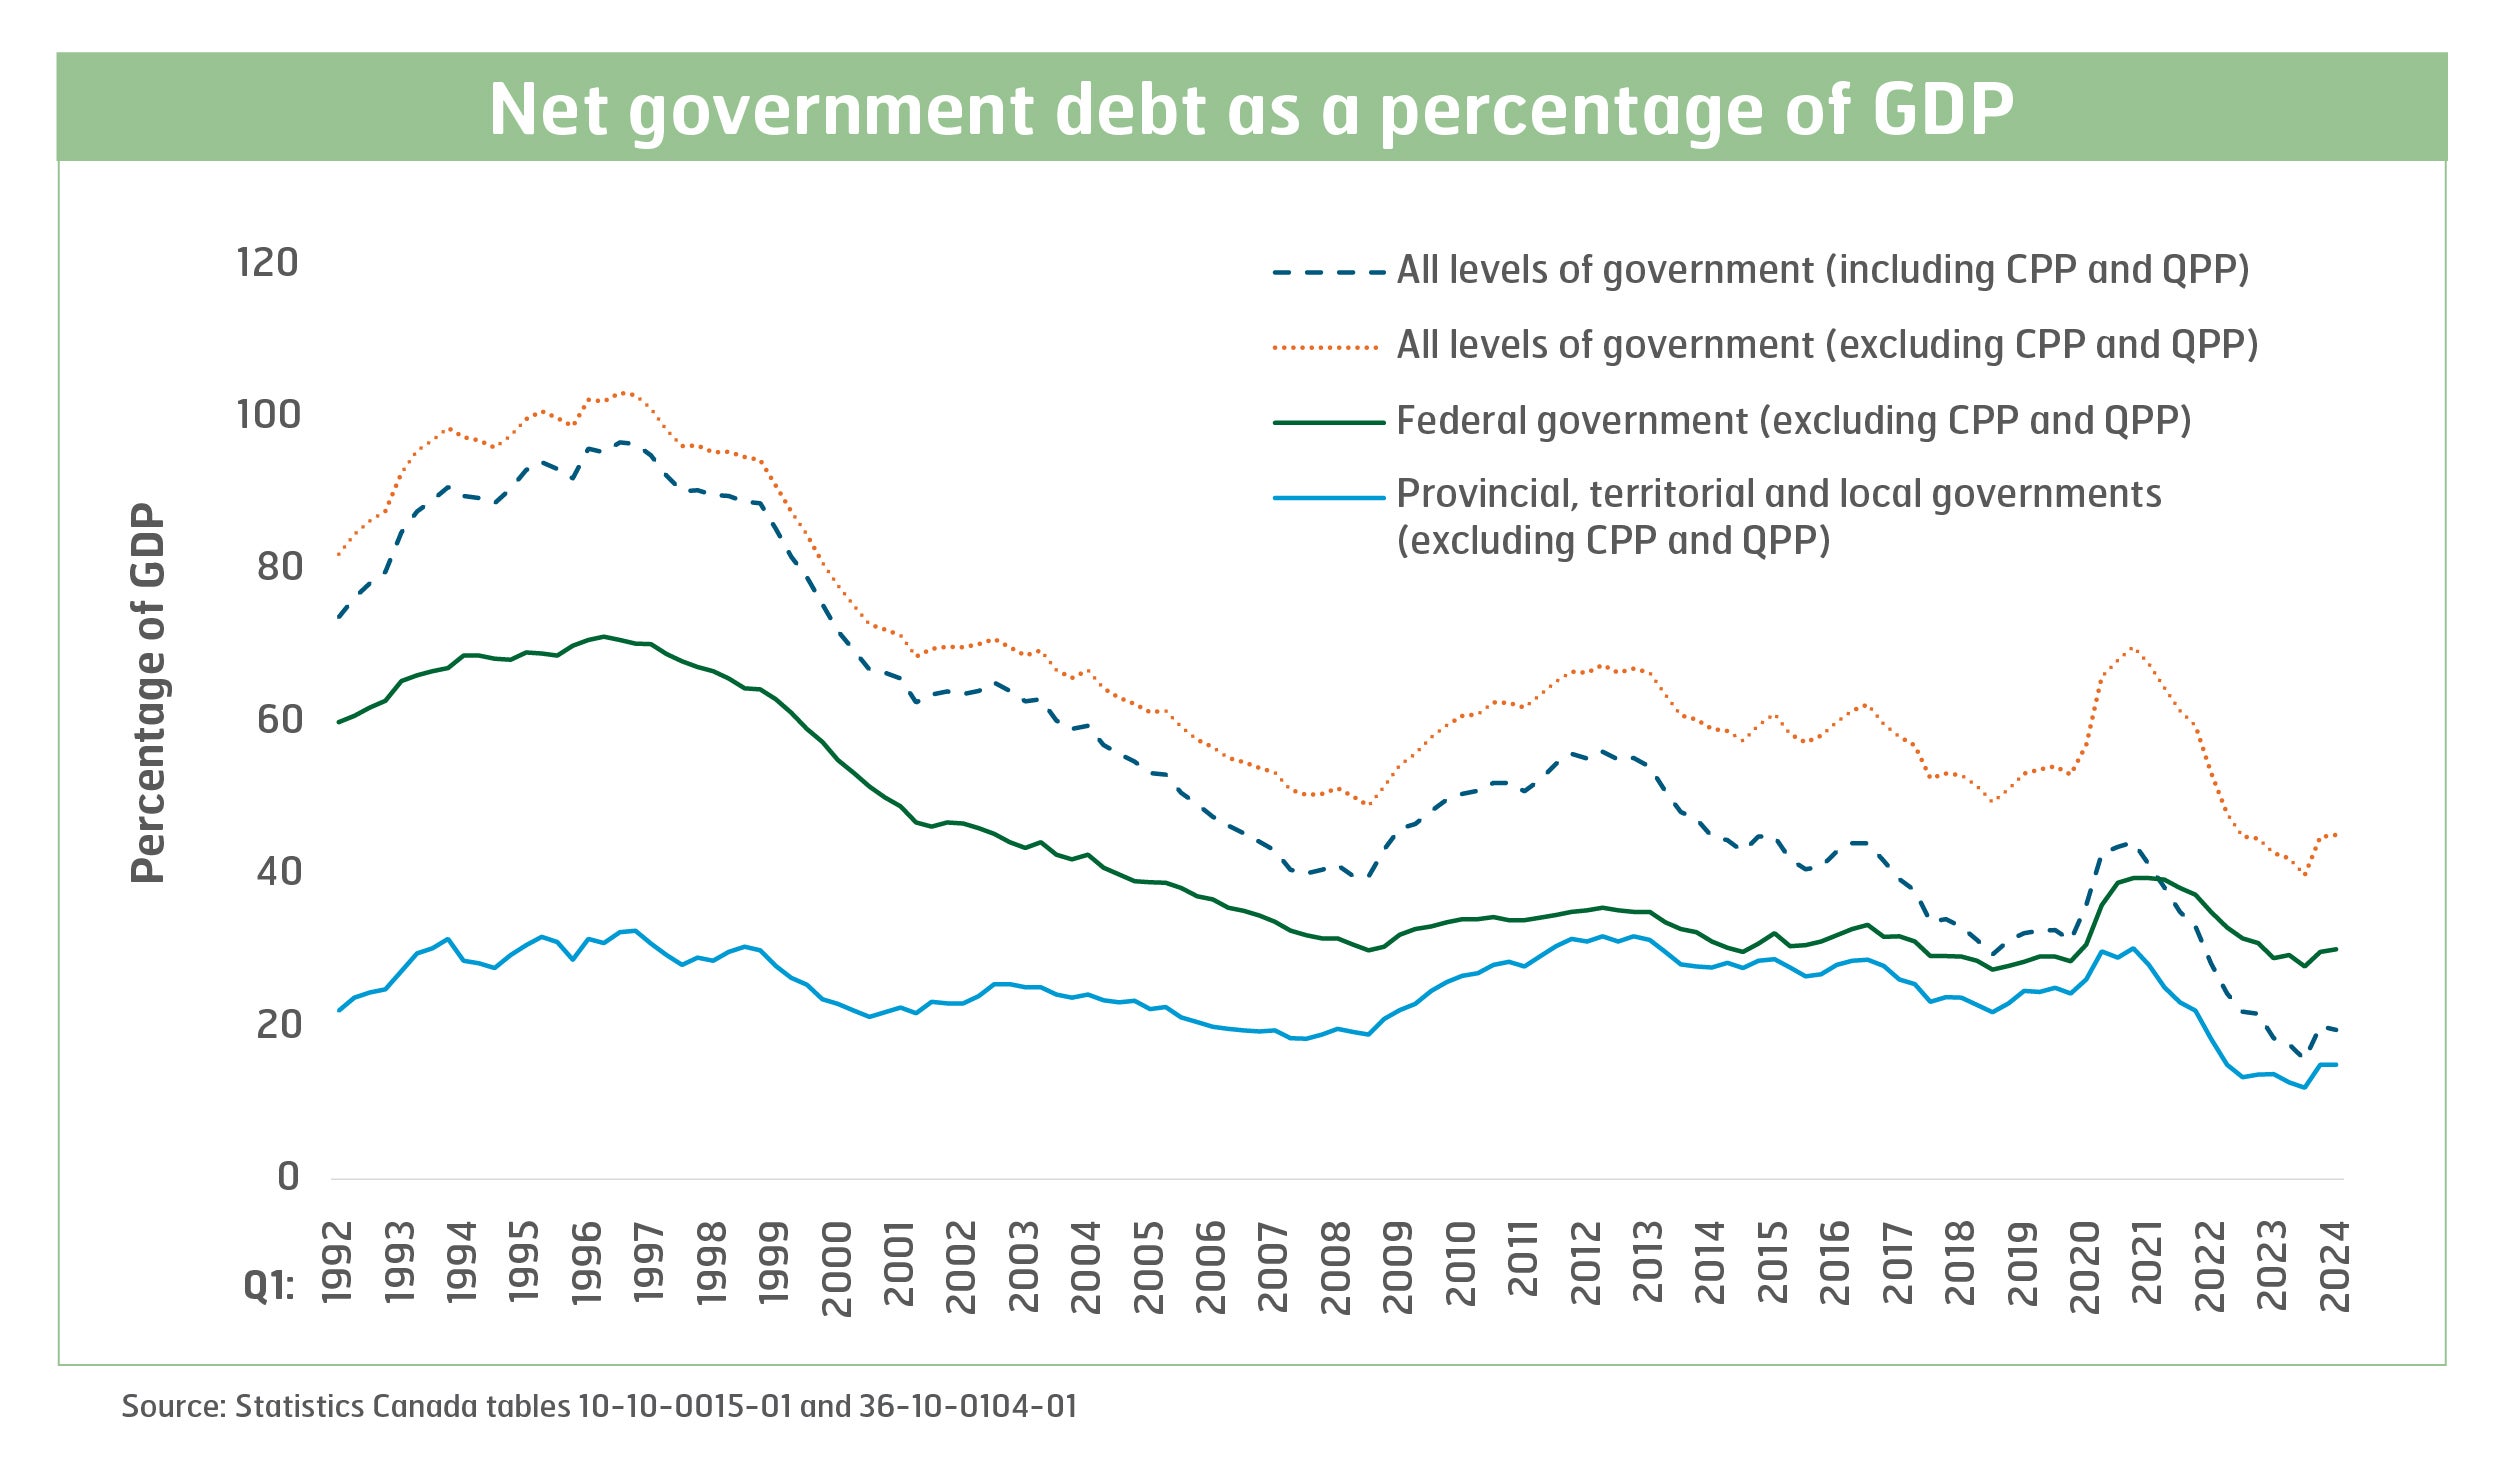
In the mid-1990s, debt across all levels of government in Canada, excluding CPP and QPP, hit over 100% of GDP. This led to significant federal budget cuts. These cuts were based on the idea that too much government debt was bad for the economy, reflecting the so-called Reganomics approach that continues to influence global economic policy today.
Debt levels subsequently fell from the mid-1990s until the 2008 financial crisis. After the crisis, net debt-to-GDP remained stable at the federal level but increased slightly at the provincial level.
During the COVID-19 pandemic, all levels of government increased spending to stabilize the economy. At the same time, GDP fell. Both factors caused net debt-to-GDP to rise in 2020 and 2021.
Despite this, federal government net debt-to-GDP, excluding CPP and QPP, is now lower than it was when Justin Trudeau was first elected nine years ago. In the fourth quarter of 2015, federal net debt-to-GDP was 31.2%. By early 2024, it had dropped to 30.2%. Provincial, territorial and local government debt has also decreased, falling from 28.1% in early 2021 to 15% in early 2024.
In fact, net debt-to-GDP levels across all levels of government are now lower than at any time in the past 30 years. The most dramatic drop is in total government net debt, including CPP and QPP, because both pension plans have continued to grow over the years.
So, remember – if someone tells you government debt is the root of all our problems, they’re spinning quite the tall tale. The reality is that government debt, when measured against the size of the economy, is lower than it has been in decades.


