This note provides broad overview of the general trends in wage settlements and other relevant bargaining information across Canada. Information is taken primarily from the Workplace Information Directorate of Human Resources Development Canada (HRDC) and Statistics Canada.
Public Sector Wage Increases Greater than Private Sector Since the Year 2000
While average public sector wage increases were well below average private sector wage increases throughout the 1990s, the public sector has recovered some of the lost ground since the year 2000. Public sector settlements were slightly higher in 2000, 2001 and 2002, but jumped to almost twice private sector increases in 2003. However part of the decline in the private sector increases is due to wage freezes and wage cuts in Air Canada agreements.
| Table 1: Base Wage Rate Adjustments, Public and Private, Canada, 1995 - 2003 | ||
| Year | Public (%) | Private (%) |
| 1995 | 0.6 | 1.4 |
| 1996 | 0.5 | 1.7 |
| 1997 | 1.1 | 1.8 |
| 1998 | 1.6 | 1.8 |
| 1999 | 2.0 | 2.7 |
| 2000 | 2.5 | 2.4 |
| 2001 | 3.3 | 3.0 |
| 2002 | 2.9 | 2.6 |
| 2003 | 2.9 | 1.5 |
Source: Workplace Information, The Wage Settlements Bulletin, February 2004.
The largest wage increases were in the education, health and social services sector (3.4%) in 2003. Wage increases in primary industries, and finance and professional services were at 2.7 per cent. The smallest increase was in trade at 1.3 per cent.
In 2002, only 0.9 per cent of all employees in settlements involving 500 or more employees were subject to a wage freeze and there were no wage cuts. However, 10.2 per cent of employees in 2003 were subject to wage freezes or wage cuts including three Air Canada contracts covering 28,530 employees.
Provincial Trends
Figure 1 shows wage increases by province during 2003 for all industries, as well as public and private breakdown.
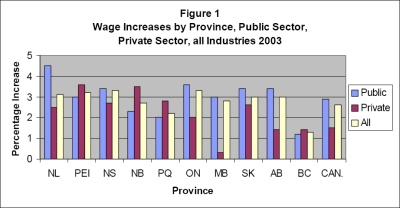
Source: Workplace Information
In 2003 average wage increases within the public sector were greatest in Newfoundland and Labrador with Nova Scotia, Ontario, Saskatchewan and Alberta not far behind. All exceeded the Canada average wage increase. BC was the hardest hit with Campbell’s Liberals keeping public sector wage gains to less than 1.5 per cent.
Over the last three years Newfoundland and Labrador have led the way in public sector wage increases followed by Alberta. B.C. increases have had a steady downward trend over the past three years. The new Conservative government in Newfoundland and Labrador is introducing wage controls. These trends are shown in figure 2.
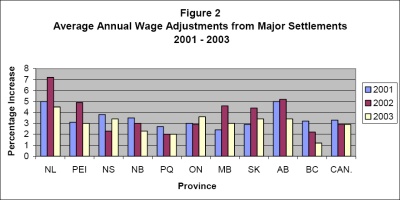
Source: Workplace Information
Current Economic Conditions
Real GDP growth in Canada 2003 was 1.7%, half what it was in 2002. However, fourth quarter growth measured 3.8% rebounding from weak 2nd and 3rd quarters. Unemployment remained virtually the same in 2002 and 2003. Inflation increased slightly from 2.2 per cent in 2002 to 2.8 per cent in 2003. Corporate profits were up 10%, on solid earnings of oil and gas, wholesale and retail companies, as corporate profits hit a record level in 2003.
| Table 2: Key Economic Indicators | ||
|
|
2002 | 2003 |
| Real GDP Growth | 3.3% | 1.7% |
| Unemployment | 7.7% | 7.6% |
| CPI | 2.2% | 2.8% |
| Corporate Profits | 4.3% | 10.1% |
Source: Statistics Canada
Selected Current Key Public Sector Negotiations
The collective bargaining climate in each province and region will be influenced by the major negotiations in progress at the present time. Table 3 below highlights some of the key negotiations to watch.
| Table 3: Key Negotiations in Progress | ||
| EMPLOYER | UNION | NO. OF EMPLOYEES |
| Gov’t of Canada | Various | 114,320 |
| Canada Customs and Revenue Agency | PSAC | 41,480 |
| Gov’t of Nova Scotia | CUPE (Public Works) | 1,600 |
| Capital District Health | NSGEU | 3,000 |
| Gov’t of New Brunswick | CUPE (Health) | 5,800 |
| Gov’t of New Brunswick | Nurses | 5,000 |
| Gov’t of New Brunswick | Teachers | 7,600 |
| Gov’t of Quebec | Various | 323,470 |
| City of Montreal | Various | 8,770 |
| Ontario Power Generation | Soc. of Energy Prof’ls | 3,930 |
| Ontario Nursing Homes | SEIU | 3,200 |
| Gov’t of Saskatchewan | SGEU | 9,860 |
| Sask. Assoc. of Health Organizations | Various | 24,530 |
| Alta Boards of Education | ATA | 13,360 |
| Health Authorities of Alberta | Various | 29,500 |
| Health Employers of BC | Various | 97,800 |
Source: Workplace Information
CUPE Research
TRANSMITTAL INFORMATION
Stan Marshall
Senior Officer, Research Branch
(613) 237-1590. ext. 228
smarshall [at] cupe.ca (smarshall[at]cupe[dot]ca)
March 12, 2004