
Drummond’s $30 billion deficit forecast wildly exaggerates Ontario’s fiscal problem
Drummond’s status quo scenario (Table 1.1, page 101) assumes the province’s revenues will grow at an average rate of only 3.2% a year. This is considerably below the 5.8% annualrate Ontario’s revenues increased from 2001 to 2007and below the rates they’ve grown over longer periods.
There is no explanation for such slow revenue growth. Provincial revenues have historically increased at a slightly faster rate than economic growth and are likely to continue to do so. Ontario’s long-term economic forecast assumes nominal GDP growth of 4.5% annually. The 2011 Fiscal Outlook projects that tax revenues will increase at an annual average rate of 4.5% over the medium term. The Canada Health Transfer and the Canada Social Transfer (over 70% of Ontario’s federal transfers) are slated to increase at annual rates of 6% and 3% respectively through 2016/17, or a combined rate of 5.2% annually.
If we assume Ontario’s revenues increase at a more moderate annual rate of 4.5%, the 2017/18 deficit would be $9.5 billion—or a third of Drummond’s forecast—if program spending increases at an annual rate of 3.5%, as he assumes.
|
Status Quo Fiscal Outlook for Ontario with more reasonable revenue estimates ($ billions) |
||||||||
|
2010/11 |
2011/12 |
2012/13 |
2013/14 |
2014/15 |
2015/16 |
2016/17 |
2017/18 |
|
|
Revenue |
106.7 |
111.5 |
116.5 |
121.8 |
127.2 |
133.0 |
139.0 |
145.2 |
|
Program spending |
111.2 |
115.1 |
119.1 |
123.3 |
127.6 |
132.1 |
136.7 |
141.5 |
|
Debt interest |
9.5 |
10.1 |
10.6 |
11.7 |
11.2 |
11.9 |
12.6 |
13.2 |
|
Deficit |
(14.0) |
(13.7) |
(13.2) |
(13.2) |
(11.6) |
(11.0) |
(10.3) |
(9.5) |
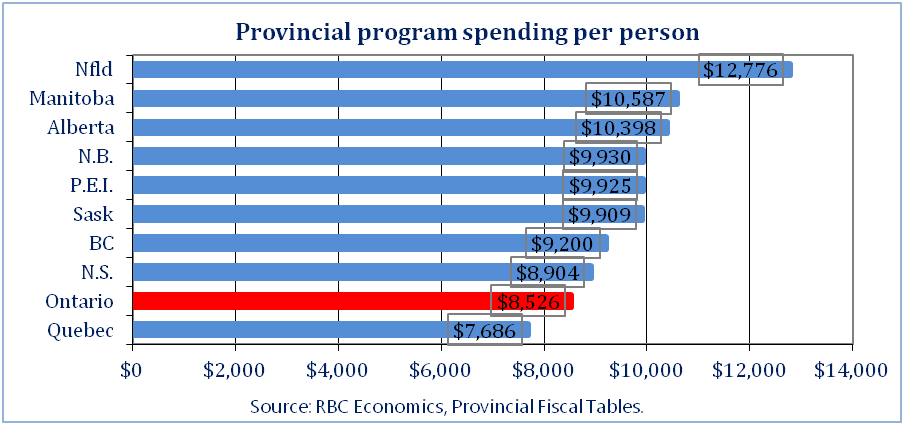
Ontario public spending is not out of control
Public spending in Ontario is far from out of control. Ontario’s program spending per person is the second-lowest of all provinces in Canada. In the decade before the financial crisis, government spending was well below its thirty-year average as a share of the economy. As the economy recovers, public spending as a share of Ontario’s economy will fall.
However, severe cuts as recommended by Drummond would endanger the recovery and could thrust Ontario back into recession. Despite the spending cuts of the 1990s, the economy was able to grow because interest rates were cut in half.
Spending cuts would damage the economy and increase unemployment
The spending cuts recommended by Drummond would be twice as deep on a real per capita basis as those under the first term of former premier Mike Harris. If Drummond’s recommendation for 0.8% annual program spending growth is implemented, Ontario’s program spending would be $23.9 billion lower in 2017/18 than it would be with moderate 3.5% growth. Using Statistics Canada employment multipliers for provincial public services, a cut in the province’s program spending of this magnitude could lead to loss of over 200,000 jobs in Ontario.[1]
Ontario should balance its budget in a balanced way with fair revenue measures
Ontario should balance its budget in a balanced way by also relying on revenue increases. For example, the following few measures could generate over $10 billion a year in revenues for Ontario—more than enough to eliminate the deficit by 2017/18 without cuts to services.
|
Progressive Revenue Options for Ontario |
||
|
Revenue measure |
Annual Revenues (billions) |
|
|
Fair taxes for corporations |
||
|
$2.0 |
|
|
$0.7 |
|
|
$1.0 |
|
|
? |
|
|
$1.3 |
|
|
$1.0 |
|
|
Progressive tax on high incomes |
||
|
$1.3 |
|
|
Close tax loopholes and improve collections |
||
|
$1.5 |
|
|
$2.0+ |
|
|
Total |
$10.8+ |
|
|
Sources:Drummond report Table 11.1, (p. 303), Appendix 18.1 (p. 427); Ontario Transparency in Taxation 2011; |
||
Prepared by:
Toby Sanger, Canadian Union of Public Employees
Erin Weir, United Steelworkers
[1] Statistics Canada’s national employment multipliers for provincial public services ranged from 12 to 20 FTE per million for 2004, with an average of 16. Accounting for inflation and provincial leakages suggests that an average of 10 FTE per million would be a reasonable estimate for Ontario public spending during the forecast period.